Scale and limits
Scale and limits
This document describes current scale and limits known in OSM as of 02/04/2021.
Considerations
The scale limits documented here have to be put in light of current architecture. Current architecture relies on a global broadcast mechanism that does not account for proxy configuration deltas, therefore all proxy configurations are computed and pushed upon any change.
Testing and measures
We currently hold a single test which attempts to scale infinitely a topology subset, test proper traffic configuration between the new pods/services being deployed in the iteration, and stop if any failure is seen. It is also acknowledged that some of the scale constraints need to be addressed before it even makes sense to proceed with any additional scale testing, hence the lack of additional test scenarios.
Test
The test was run in different OSM form factors, factoring in different amounts of RAM/CPU, to better qualify potential limits in case any of those were to be a constraint upon deployment.
For all tests:
- Change ID 9b829667f797879a0a4cd911eb08c4808e0f8083 (Thu Feb 4 13:38:37 2021)
- 8 Node (Kubernetes v1.18, nodes: 4vcpu 16Gb)
- Envoy proxy log level Error
- OSM controller log level Trace (reasons)
- HTTP debug server disabled on OSM
- Test topology deploys each iteration:
- 2 clients
- 5 replicaset per client
- 5 server services
- 2 replicaset per server service
- 1 TrafficSplit between the 5 server services (10 pods backed)
- Total of 20 pods each iteration. 10 client pods will REST GET the Traffic split.
- Correctness is ensured. It is checked that all TrafficSplit server members are eventually reached.
- 2 clients
- Test timeout for network correctness: 150 seconds
Varying form factors
- with 256MB max RAM
- 1.5 CPU
- With 512MB RAM
- 1.5 CPU
- 4 CPU
(All tests were run multiple times to ensure validity of the results)
Assessment
Note: Please assume we are deploying a proxy per pod in the following results, so use pod/proxies interchangeably.
Memory
- Memory per pod/envoy onboarded in the network is calculated after the initial snapshot with nothing onboarded on the mesh is seen to take into account standalone memory used by OSM.
- Initial memory use of OSM 40~46MB
- Memory increase per pod ranges between 800KB~1MB per pod.
- With 256MB max memory limit for OSM’s container, 180-200 pods should be a conservative limit. Any more pods
can (and will) have OSM
OOMKilledby Kubernetes. - With 512MB max memory limit for OSM’s container, it can reach to ~400 pods, although convergence times will spike through the roof up to +120s with a rather oversubscribed CPU profile, that could potentially lead to other issues.
CPU
1.5/2 vCPU (512MB mem)
- At 200 pods, ADS completion times[1] for individual envoys range around 10s-20s and full configuration convergence ranges around 20-40s
- At 400 pods, ADS completion times[1] for individual envoys range around 40-90s and full configuration convergence ranges around +150s
- Injector webhook and certificate (2048 RSA) issuance times are stable between 1s-5s in all cases.
4 vCPU (512MB mem)
-
At 200 pods, ADS completion times[1] for individual envoys range around 5-10s, however full configuration convergence falls into the 20-40s bucket.
-
At 400 pods, ADS completion times[1] for individual envoys range around 20-40s and full configuration convergence ranges around +90s
-
Injector webhook and certificate (2048 RSA) issuance times are stable between 1s-5s in all cases.
-
In both cases, and taking into account the architecture limitations explained above, OSM will run hot on CPU, most of the time recomputing ADS updates for all pods in the mesh. This oversubscription could lead to not enough cycles available for other critical path routines (liveness), depending entirely on the scheduler.
-
Adding more vCPU helps OSM compute a larger amount of ADS updates at a time, as well as reduce the configuration convergence time - however due to the nature of the buckets, we suspect this is far from a linear improvement as some of these numbers could suggest.
Below, more results with meaningful related data explained.
Detailed Test Results
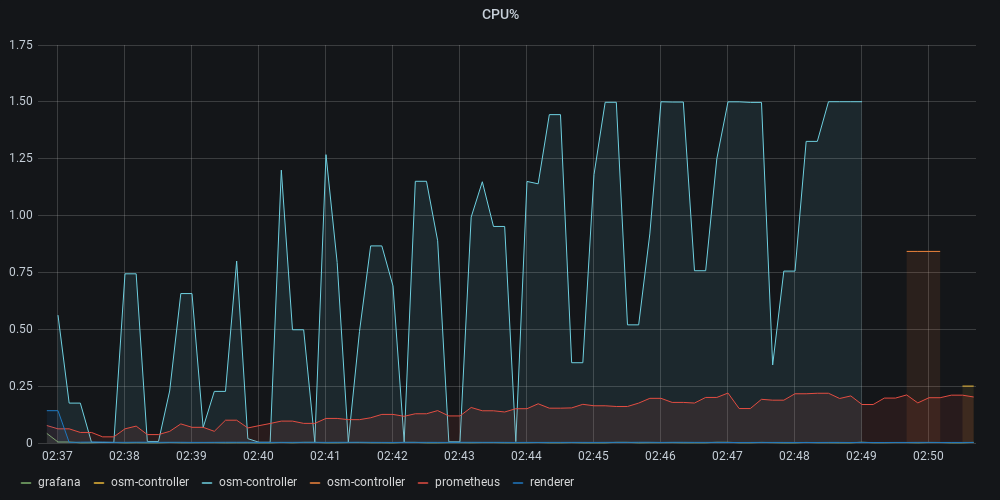
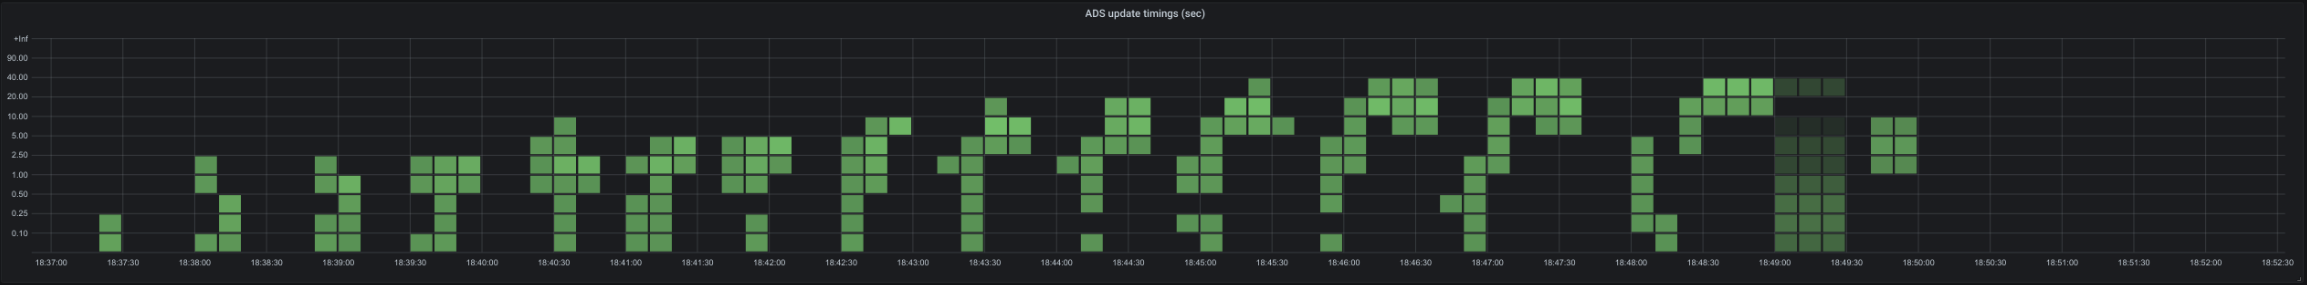
256 RAM @1.5 CPU
- OSM is killed (OOM) at around ~260 Pods
- mem/pod on OSM is grossly around 787kB
- Full CPU utilization is first seen at around ~180-200 pods.
- At around 200 pods, ADS updates get bucketed at between 10-20s to 20-40s seconds collectively[1].
- Certificate issuance: constant, going from 1s to 5s buckets at most, with some non-trended outliers.
- Webhook injector: constant, ranging also from 1s to 5s, with some non-trended outliers.
256MB poses a hard limit on the number of pods supported, hence we did not proceed to test other cpu form factors with 256MB.
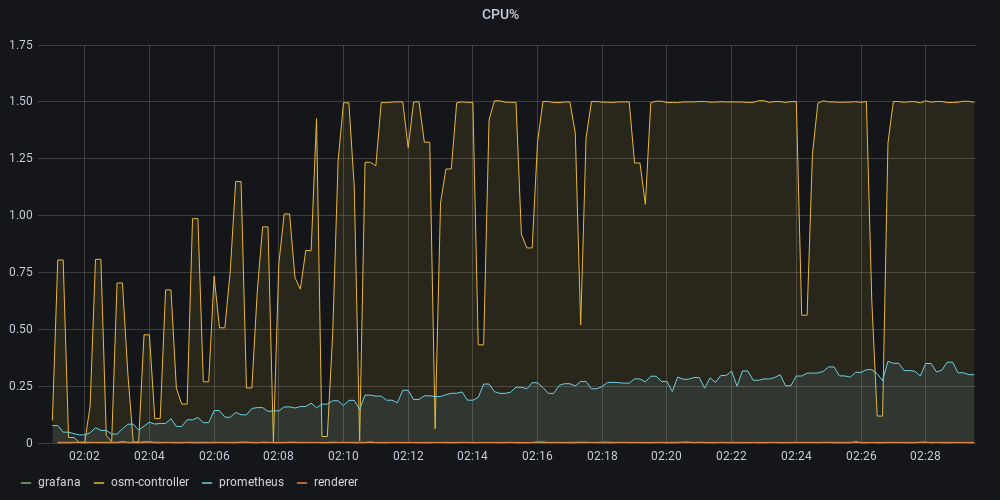
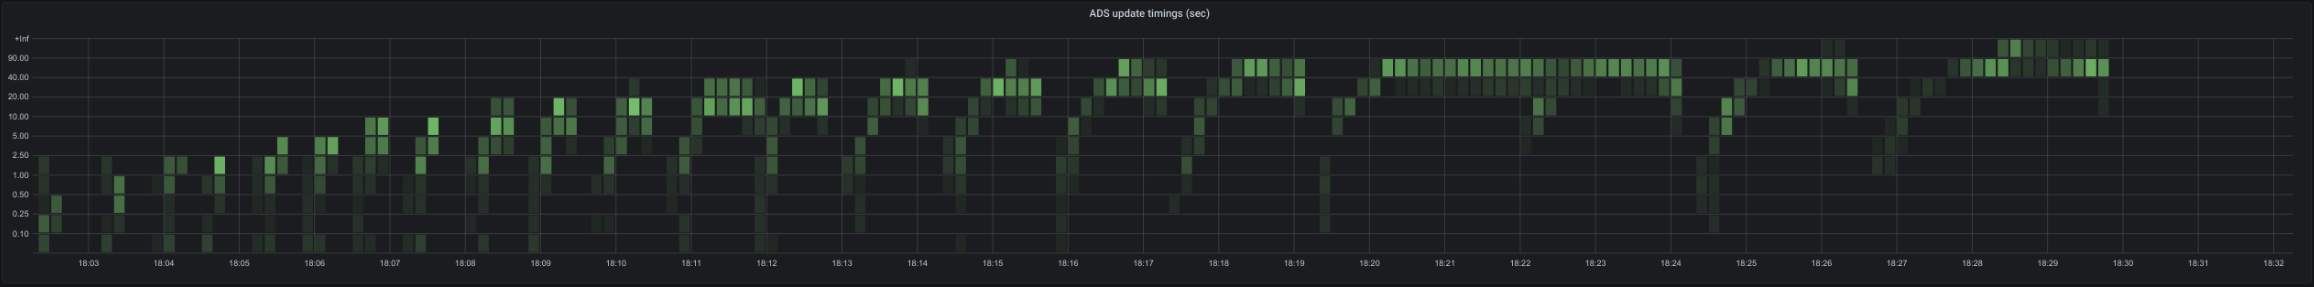
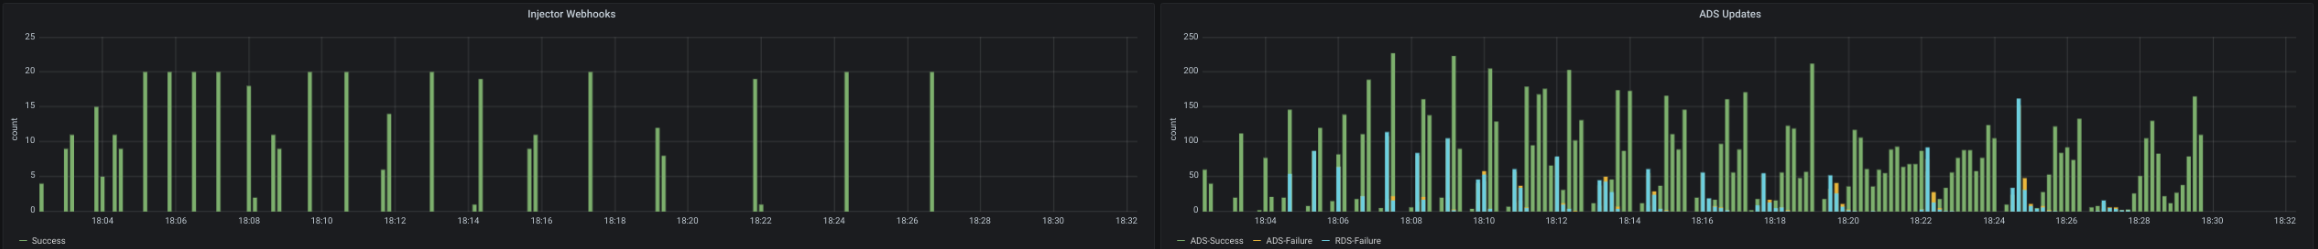
512RAM @1.5 CPU
- OSM fails to converge network configuration at around ~440 pods (Test timeout).
- Mem/pod on OSM is grossly around 968kB
- Large prolonged periods of full CPU usage and saturation.
- Certificate issuance and Webhook injector trend to take a little bit more on average on higher pod count, but still in the 1s to 5s margin.
- A number RDS updates seems to be consistently failing.
Injector & ADS (success/failure) update count
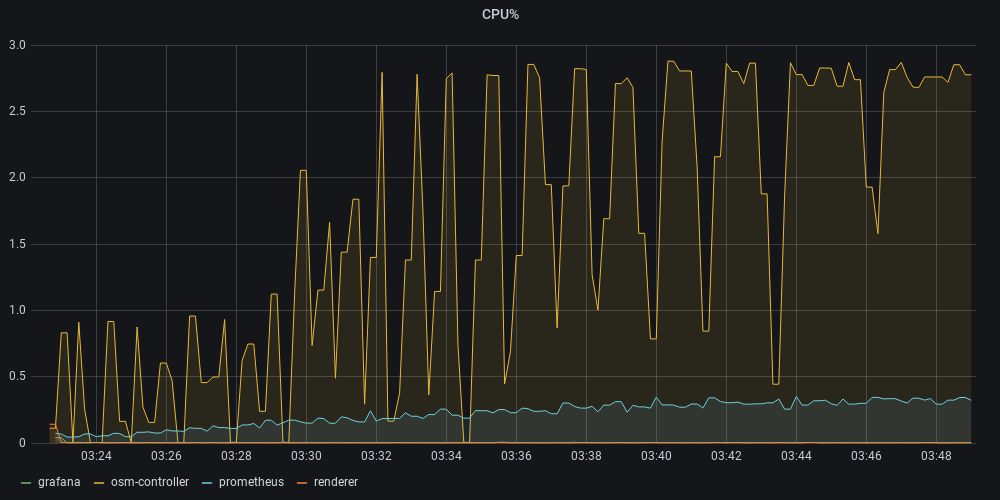
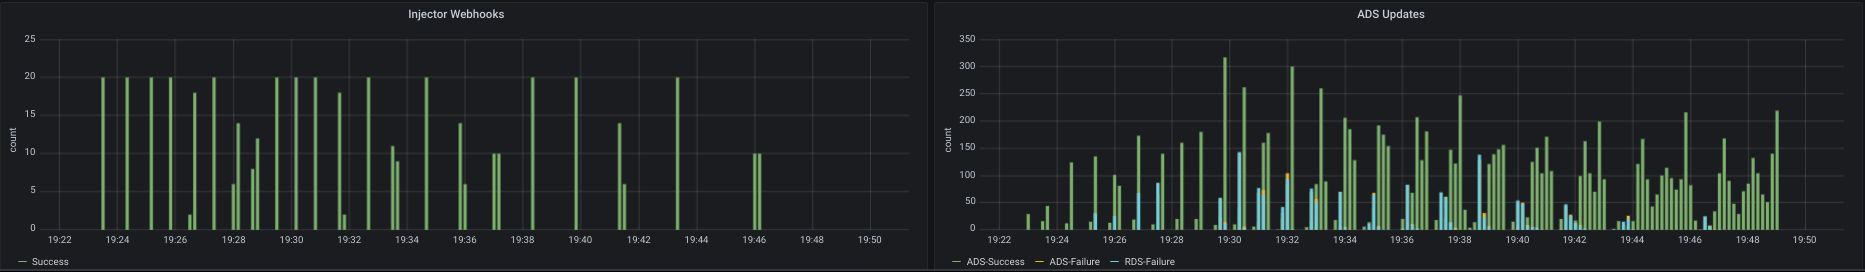
512RAM @4CPU
- OSM fails to converge network configuration at around ~460 pods (Test timeout).
- Mem/pod on OSM is grossly around 982kB
- Cpu peaks at around ~2.7 utilization. Supposedly CPU to spare.
- Certificate issuance and Webhook injector trend to take a little bit more on average on higher pod count, but still in the 1s to 5s margin.
- A number of RDS updates seems to be consistently failing.
Injector & ADS (success/failure) update count
[1]: Note that collective updates do not mean <time> per ADS update, but since all updates are scheduled at the same time (coroutine per proxy) they share the same cpu time at the mercy of the scheduler, and on average, they all start and finish <time> seconds apart. The exact time taken per update should be a division of that time by the number of updates being handled at a time interval by the scheduler, which we don’t have an accurate count of because we don’t know when the scheduler schedules them.
Feedback
Was this page helpful?
Glad to hear it! Please tell us how we can improve.
Sorry to hear that. Please tell us how we can improve.